File:Illustration of contemporary and past human populations Our World in Data.png
Nea wohwɛ yi ne tibea: 402 × 599 pixels. resolutions: 161 × 240 pixels | 322 × 480 pixels | 515 × 768 pixels | 687 × 1,024 pixels | 1,375 × 2,048 pixels | 5,201 × 7,747 pixels. Foforɔ
Krataa no ankasa (5,201 × 7,747 pixels, file size: 2.4 MB, MIME type: image/png)
Tɔ fa
| Ɛmu nkyerɛkyere mu |
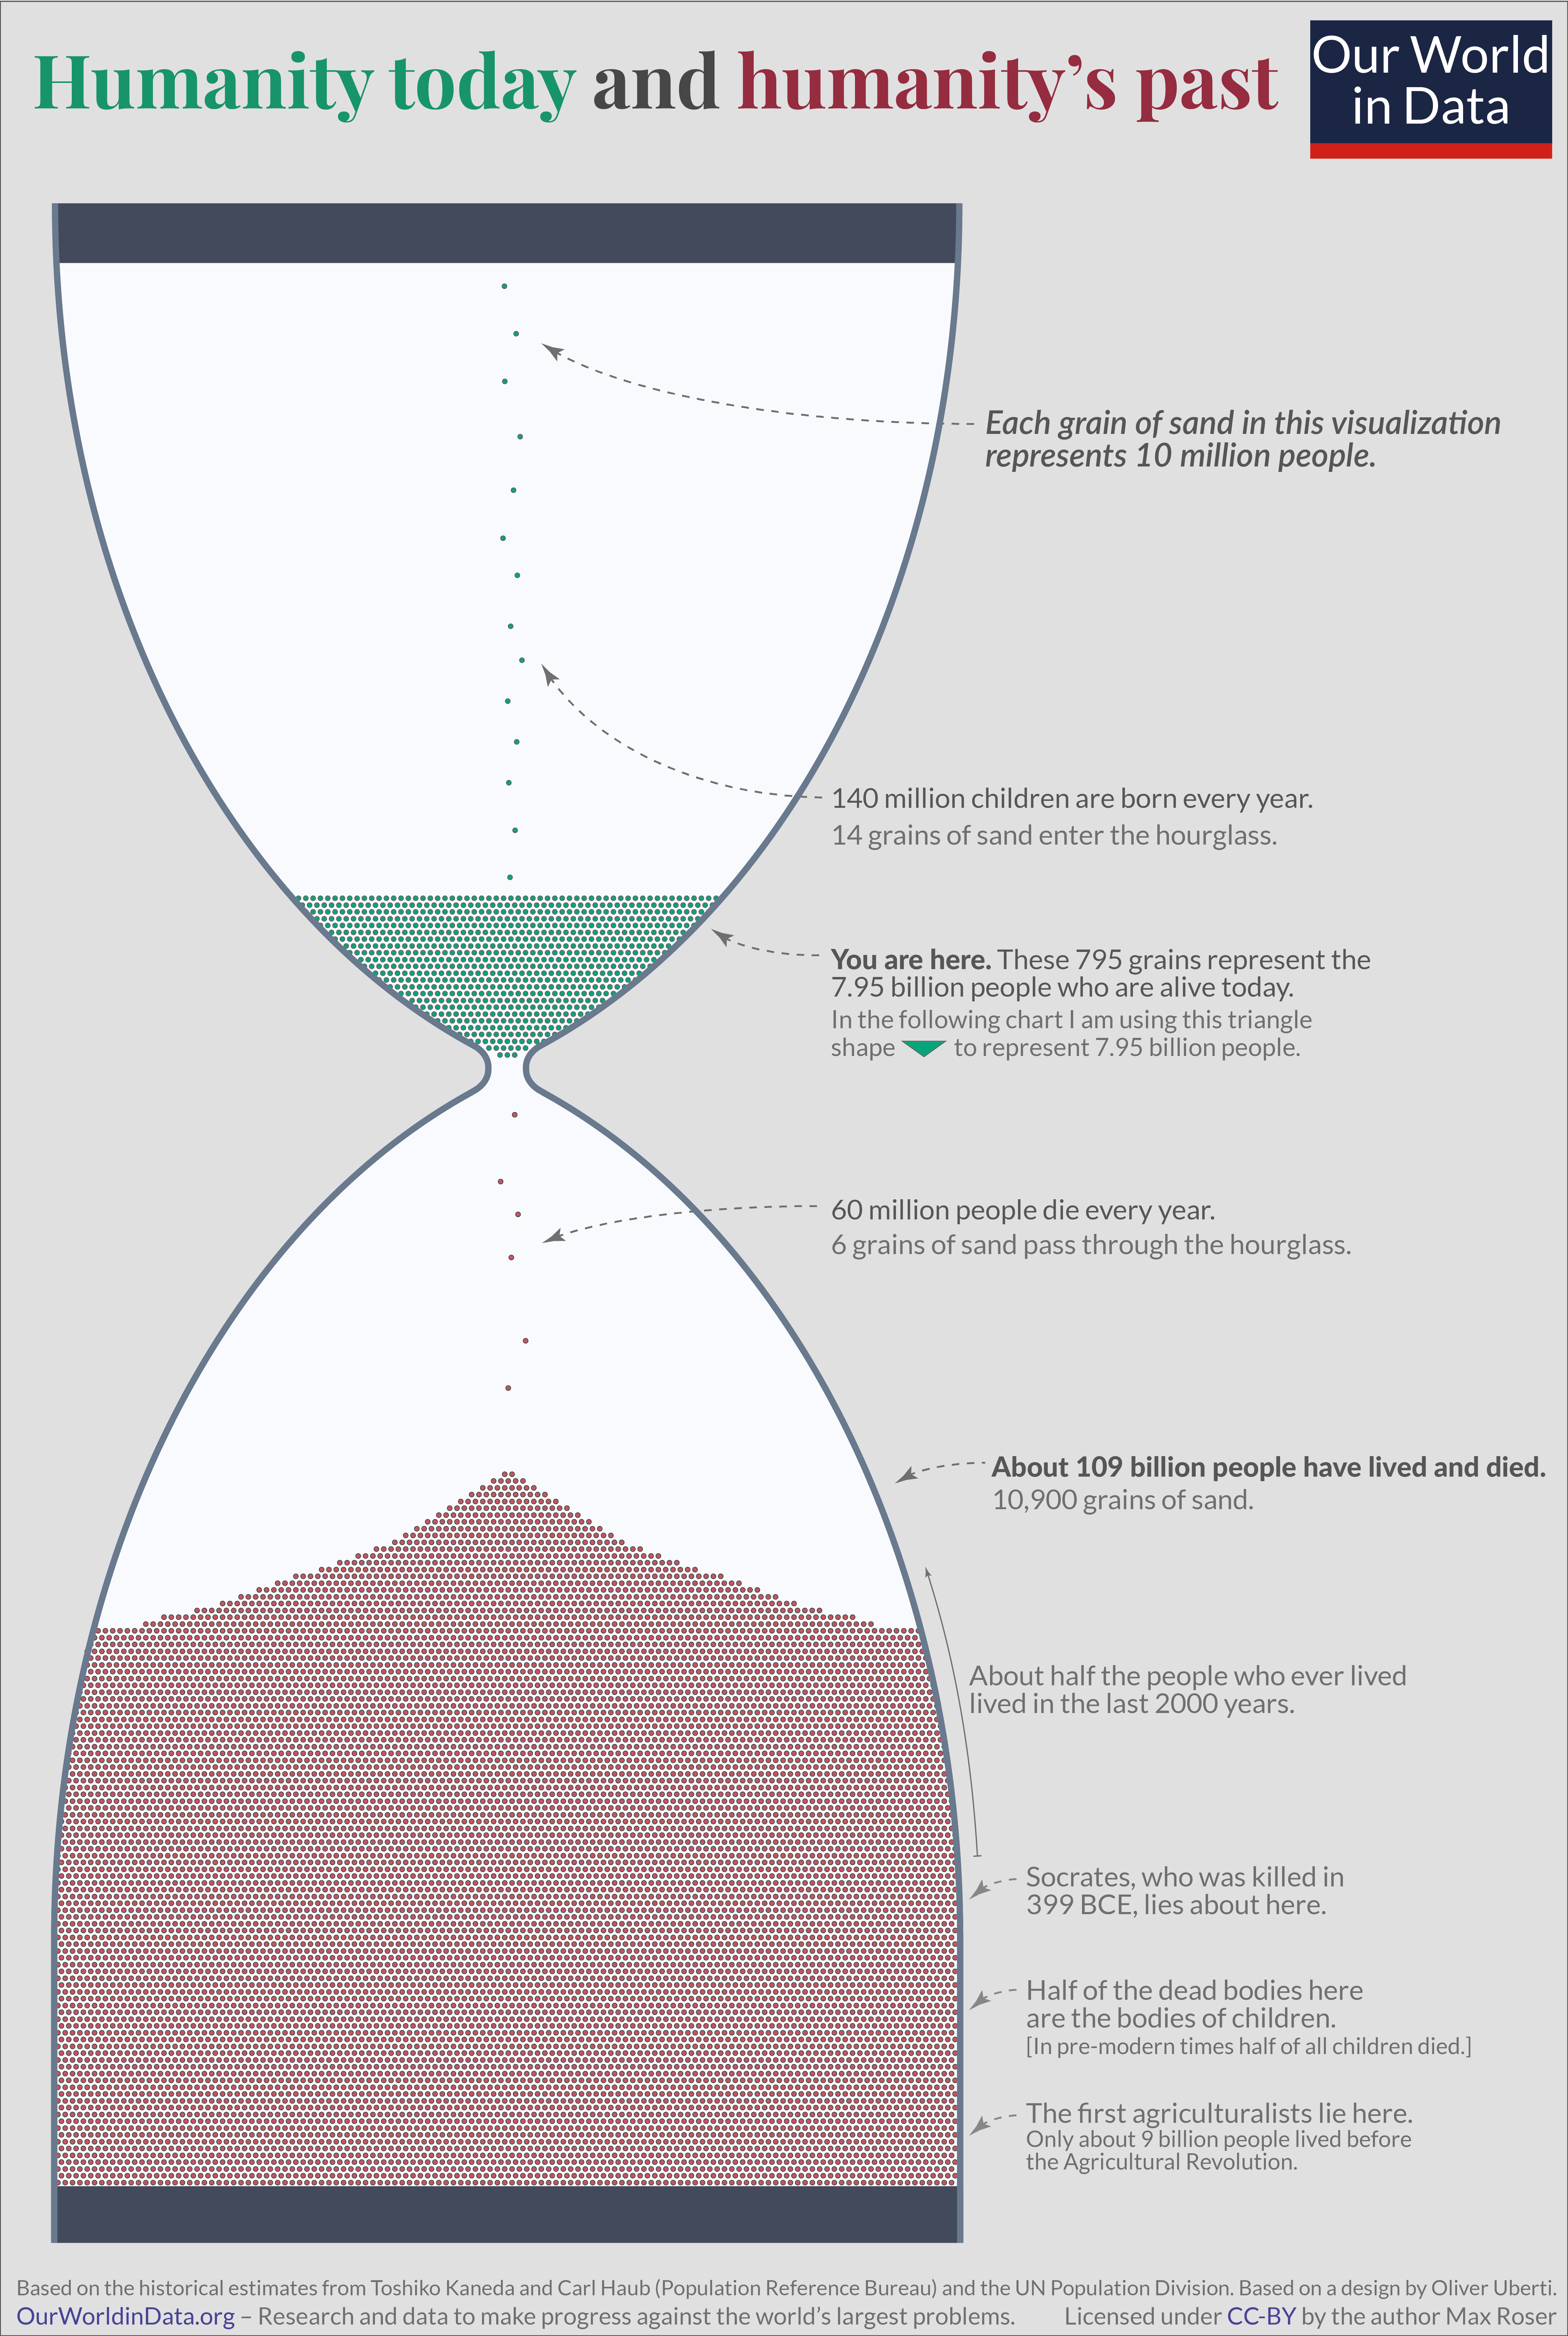
English: An illustration comparing the population size of the present generation to all humans in the past |
| Da | |
| Beaɛ a ɛfiri | https://ourworldindata.org/longtermism |
| Ɔtwerɛfoɔ | Max Roser |
| Other versions |
|


|
This diagram image could be re-created using vector graphics as an SVG file. This has several advantages; see Commons:Media for cleanup for more information. If an SVG form of this image is available, please upload it and afterwards replace this template with
{{vector version available|new image name}}.
It is recommended to name the SVG file “Illustration of contemporary and past human populations Our World in Data.svg”—then the template Vector version available (or Vva) does not need the new image name parameter. |
Tumidie krataa
This file is licensed under the Creative Commons Attribution 4.0 International license.
- Wo de woho:
- sɛ wo bɛ kyɛ – to copy, distribute and transmit the work
- to remix – Ma dwumadie no mfa
- Ɛwɔ saa mbra yi ase:
- Nea ɛnam so – Ɛsɛ sɛ wo de nnidi, kyerɛ beaɛ a tumidie krataa no wɔ, na san kyerɛ sɛ nsesae bi aba mu anaa. Ɛsɛ sɛ wo kyerɛ ɛwɔ kwan pa so, na ɛmom ɛnyɛ ɔkwan a ɛkyerɛsɛ nea tumidie krataa no yɛ ne de no agye atum sɛ fa yɛ adwuma.
Kratafa ne ho abakɔsɛm
Mia ɛda/berɛ no so na hwɛ sɛnea krataa no baeɛ wo saa berɛ nom
| Da/Mmere | Tɔfabɔ | Akwan ahodoɔ | Odwumdini | Adwenkyerɛ | |
|---|---|---|---|---|---|
| nea ɛkɔ so | 18:25, 17 Ɔbɛnem 2022 | | 5,201 × 7,747 (2.4 MB) | Ego.Eudaimonia | Uploaded a work by Max Roser from https://ourworldindata.org/longtermism with UploadWizard |
Nkrataa a wɔde di dwuma
Nea ɛdidisoɔ yi 2 nkratafa dwumadie this file:
Nea wiase nyinaa de yɛ adwuma
Wikis a edidi so yi de di dwuma:
- Yɛ de ayɛ adwuma wɔ en.wikipedia.org
- Yɛ de ayɛ adwuma wɔ es.wikipedia.org
- Yɛ de ayɛ adwuma wɔ pt.wikipedia.org
- Yɛ de ayɛ adwuma wɔ ru.wikipedia.org